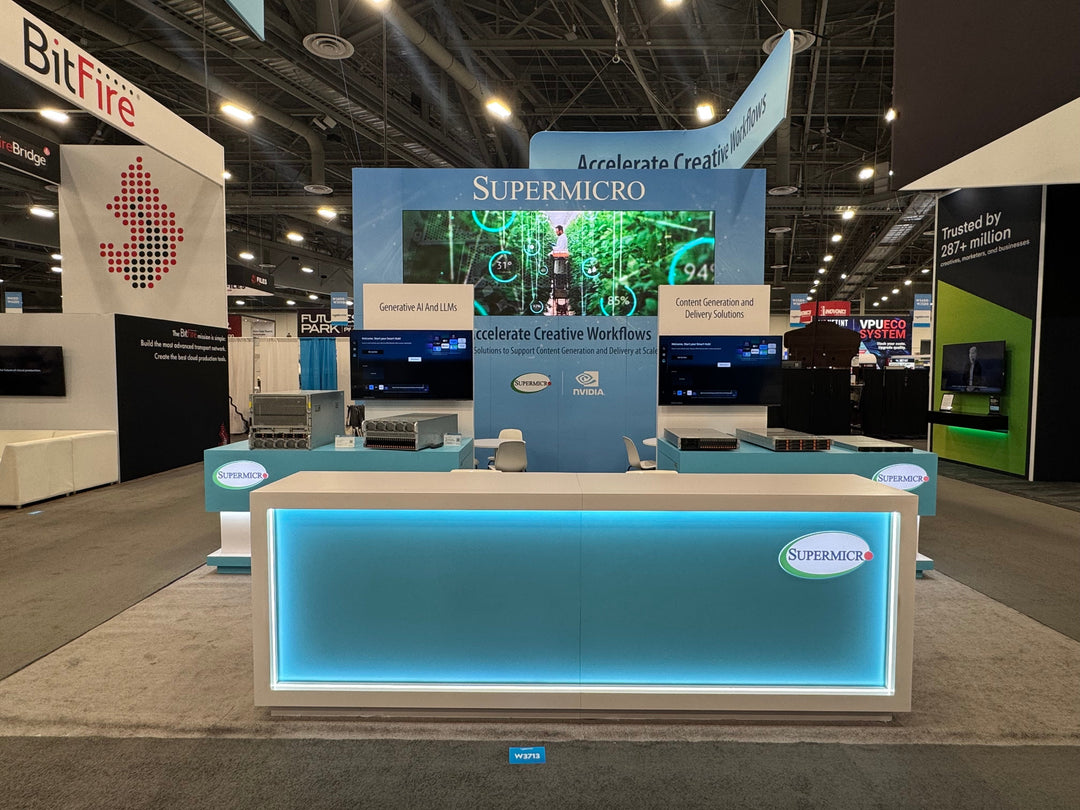
Trade shows are a significant investment—of time, money, and effort. But the real ROI doesn’t just come from what happens during the event; it comes from what you learn afterward. Post-show analytics offer a goldmine of insights that can help you optimize your booth design, engagement tactics, and overall trade show strategy. In this article, we’ll explore the value of post-show analytics, what data to track, and how to use that information to refine your approach for future success.
Why Post-Show Analytics Matter
Many exhibitors focus heavily on pre-show marketing and booth design but fall short when it comes to post-show evaluation. Yet, it is this phase that provides the clearest window into what worked, what didn’t, and why.
Benefits of Post-Show Analytics:
-
Measure ROI: Assess the effectiveness of your trade show investment.
-
Identify High-Performing Elements: Determine which booth elements or tactics attracted the most attention.
-
Improve Future Booth Design: Use data to inform layout, signage, and interactivity.
-
Refine Lead Scoring & Sales Strategy: Understand which leads are high-value and how they engaged.
-
Optimize Budget Allocation: Focus future spending where it matters most.
At KSM Exhibits, we help clients not only design and fabricate booths but also integrate tech that enables performance tracking, making post-show analysis far more accessible.
Key Metrics to Track After the Show
Effective post-show analysis starts with identifying the right metrics to track. Here are the most critical categories:
1. Lead Generation Metrics
-
Number of Leads Collected
-
Lead Quality (based on scoring or qualifications)
-
Lead Source (walk-ins, pre-booked, referral, etc.)
2. Engagement Metrics
-
Dwell Time: How long attendees stayed in the booth.
-
Heat Mapping: Which areas of the booth drew the most attention.
-
Interaction Rates: Number of product demos, VR activations, or touchscreen uses.
3. Marketing Performance
-
Email Capture Rates
-
Social Media Mentions and Tags
-
QR Code or Landing Page Hits
4. Sales Metrics
-
Sales Pipeline Movement Post-Show
-
Deals Closed from Show Leads
-
Average Deal Size vs. Average for Other Sources
5. Cost Analysis
-
Cost per Lead (CPL)
-
Cost per Qualified Lead (CPQL)
-
Total ROI (revenue generated vs. spend)
Tools and Technologies to Gather Data
To gather actionable data, you need the right tools in place before the show. Here are technologies KSM Exhibits recommends and integrates into client booth designs:
Lead Capture Tools
-
Badge Scanners and Apps: Instant data collection from attendee badges.
-
Digital Forms on Tablets: Custom qualification questions.
Engagement Tracking
-
Motion Sensors & Heat Maps: Visualize foot traffic patterns.
-
RFID or NFC Tags: Track where attendees go within the booth.
Marketing Analytics
-
UTM-Tracked QR Codes: For measuring digital engagement.
-
Event-Specific Landing Pages: Monitor pre- and post-show web activity.
CRM Integration
-
Real-Time Syncing: Automatically transfer leads and notes into your CRM.
These tools allow exhibitors to collect not just quantitative data, but also qualitative insights based on interaction patterns.
How to Analyze Your Post-Show Data
Once you have your data, the next step is turning it into actionable insights. Here’s how to evaluate each major area.
1. Evaluate Booth Engagement
Compare heat mapping and dwell time data against your booth layout. Did your featured product go unnoticed? Was there a bottleneck that prevented access to your demo station?
Actionable Insight:
If attendees spent more time in a lounge area and less in the demo zone, consider repositioning displays or making the demo more interactive.
2. Qualify Lead Data
Not all leads are created equal. Filter your data based on quality and how each lead engaged at your booth.
Actionable Insight:
If walk-ins produced more qualified leads than scheduled meetings, you may want to invest more in booth attraction methods and signage.
3. Cross-Reference Sales Outcomes
Compare booth-generated leads with closed deals and their timeline. How quickly did they convert? How large were the deals?
Actionable Insight:
High-converting verticals can help guide your messaging or target audience for the next show.
4. Evaluate Content & Messaging
Analyze engagement rates on digital content like videos, AR/VR, or touchscreens.
Actionable Insight:
If video content had low engagement but hands-on demos performed well, future booth design should lean into tactile and immersive experiences.
5. Budget Reallocation
Use cost per lead and ROI analysis to see where your money went the farthest.
Actionable Insight:
If a $5,000 interactive game brought in twice as many qualified leads as a $10,000 display wall, your future budget should reflect that value.
Using Analytics to Refine Booth Design
Here’s how the insights above directly impact future booth strategies:
Optimize Layout
-
Use heatmaps to identify which areas of your booth attracted traffic or got ignored.
-
Restructure layout to enhance flow and visibility.
Improve Graphics and Signage
-
Analyze which messaging drew attention or led to conversions.
-
Test different messages and imagery in future shows.
Personalize Engagement
-
Based on lead data, develop targeted demos or segmented pitches.
-
Use attendee behavior data to customize how staff interacts with visitors.
Increase Retention Opportunities
-
Reassess giveaway items and their ROI.
-
Track if those who received freebies were more likely to become customers.
Real-World Example: Analytics in Action
Client: SaaS Company at CES
Challenge: High booth traffic but low post-show conversions.
Solution: KSM Exhibits incorporated RFID badges and touchscreen data tracking into their next exhibit. They discovered that:
-
Visitors spent time in photo booth and lounge areas but ignored the demo zone.
-
60% of high-value leads came from those who engaged with the demo.
Outcome: For the next show, we redesigned the booth with:
-
Relocated demo stations to center stage.
-
Visual pathways (lighting & signage) directing traffic flow.
-
Staff trained to redirect and qualify visitors more effectively.
Result: 38% increase in lead quality and a 21% uptick in closed deals within 60 days of the show.
Best Practices for Post-Show Analysis
-
Schedule a Debrief Immediately: While the experience is fresh.
-
Survey Your Team: Get qualitative feedback from booth staff.
-
Follow Up Promptly: Contact leads within 72 hours.
-
Benchmark: Compare data to previous shows.
-
Refine Your Goals: Set SMART goals based on findings.
How KSM Exhibits Can Help
At KSM Exhibits, we don’t just build booths—we build strategies. Our services include:
-
Integrating data tracking technology into booth designs.
-
Post-show analytics consultation.
-
Iterative design improvement based on performance.
Whether you're renting a 10x10 or building a custom island exhibit, we help you get the most from your investment, show after show.
Want to turn trade show insights into action? Let KSM Exhibits design a booth experience that not only draws attention but also delivers measurable results. Contact us today to learn how we can help you turn data into smarter decisions and better ROI.


